
Flow
The flow perspective provides different views of our capacity by visualizing the flow in terms of CFD, Throughput and lead times.
Cumulative Flow Diagram
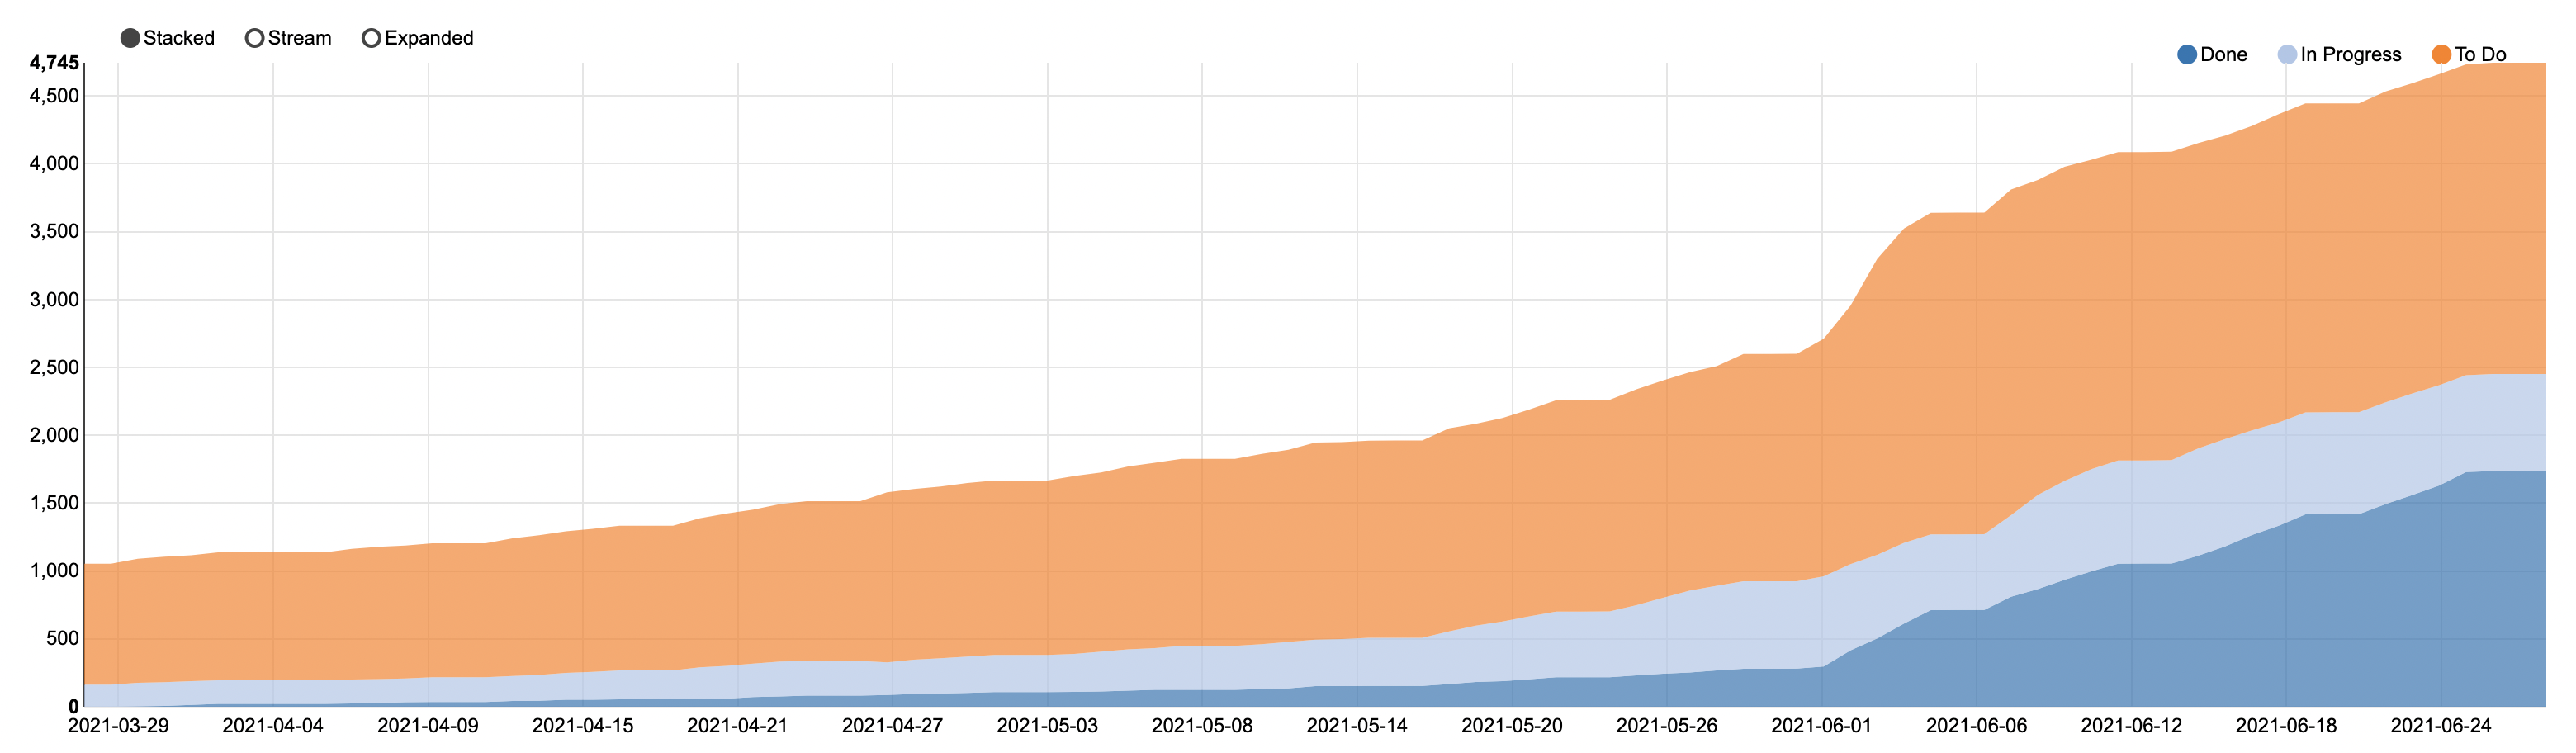
This view visualizes
- Number of issues in each state over time
- Hover for a view of specific number of issues a specific date
- Growing width indicates Bottleneck
- De-select Done to get a burndown view
- Select active states to get WIP
- Slope shows throughput
Iteration Report
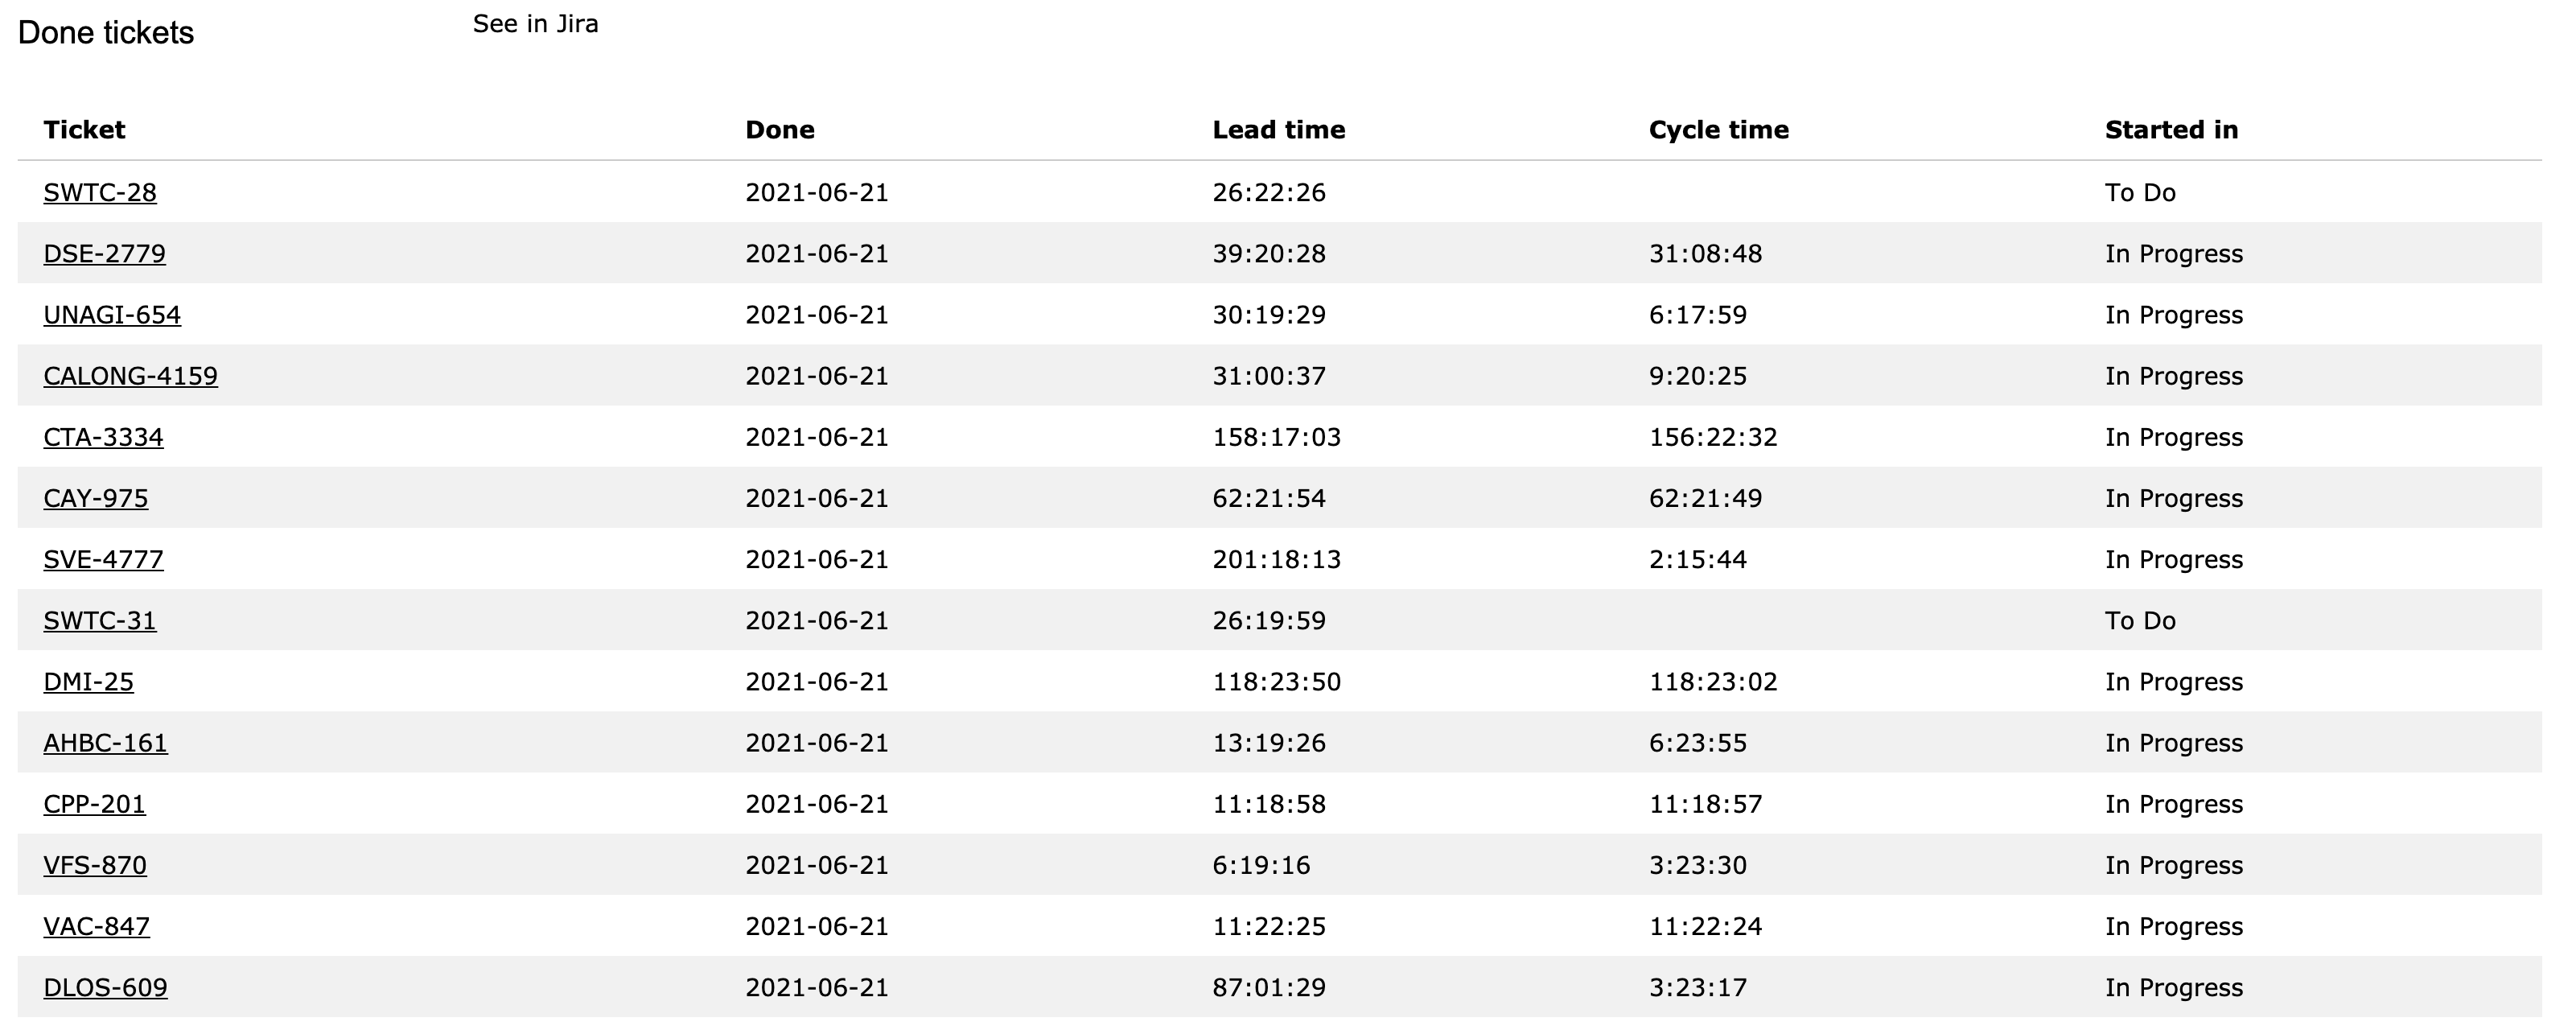
This view visualizes
- List of all issues closed in the iteration
- Select start state to get cycle time
- Empty cycle time for issues drawn directly to done
Lead Time
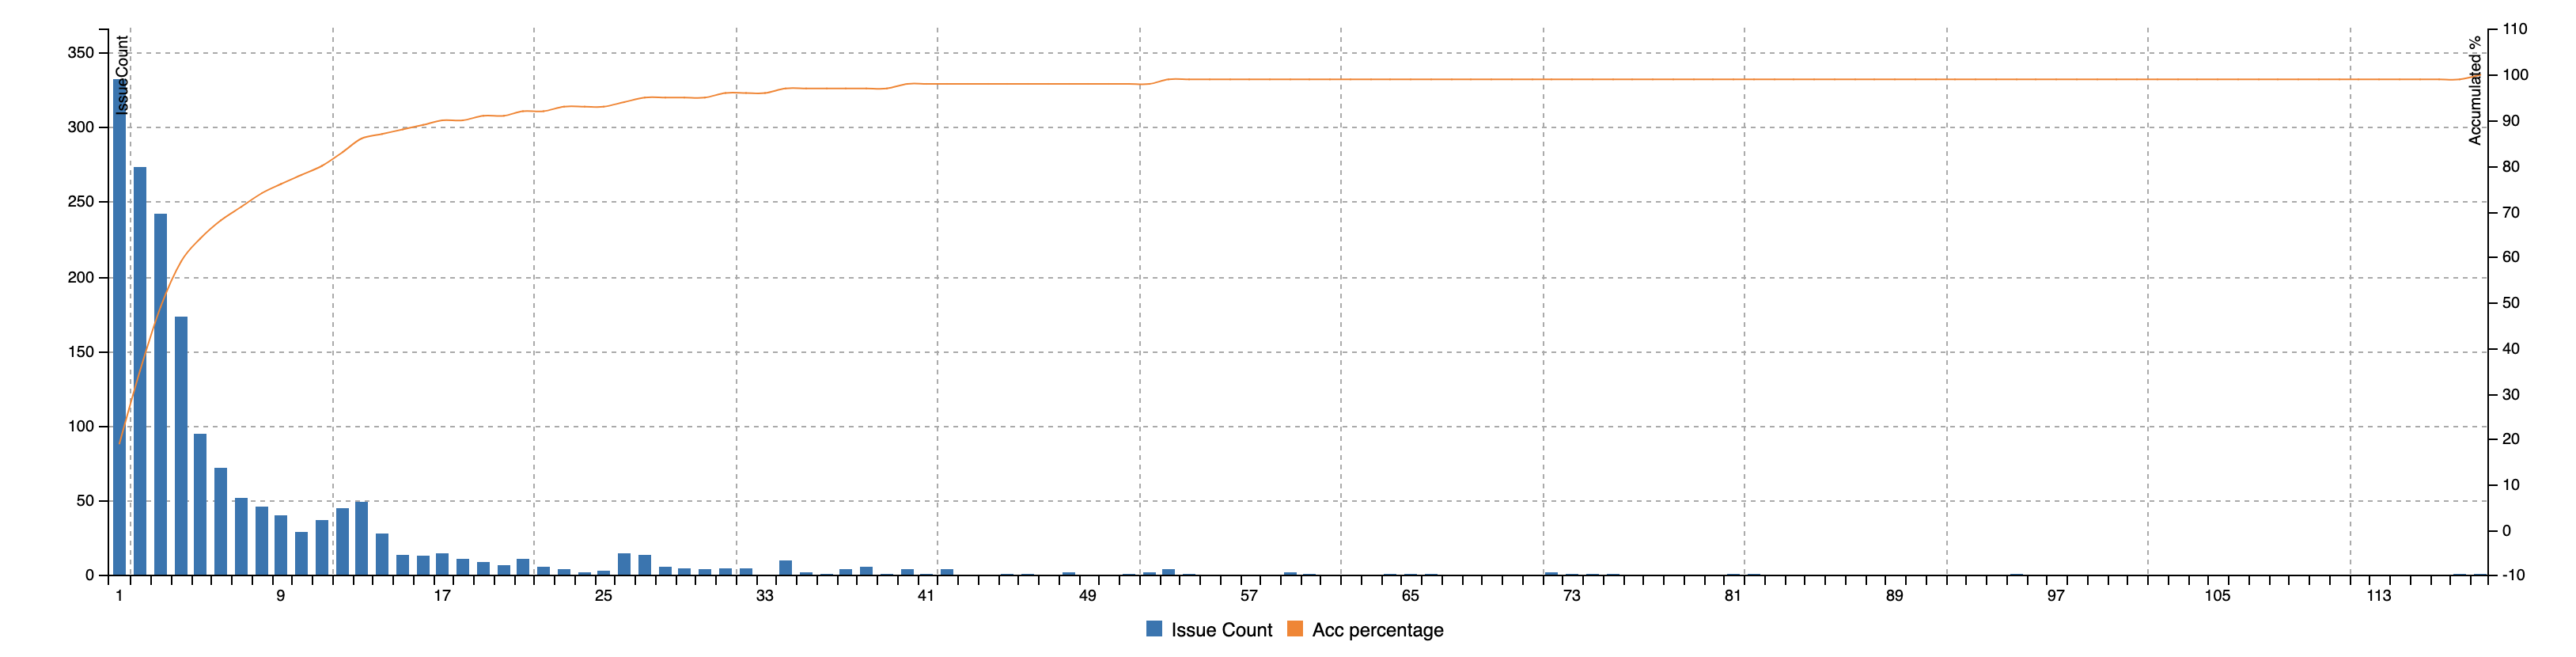
This view visualizes
- Lead time, shows the distribution of lead times for closed issues
- Cycle time by selecting a start state
- First bar is for zero lead/cycle time (drawn directly to done)
- Ticket age shows a distribution of how old open issues are
- Selecting a start state shows time since open issue first appeared in state
Throughput
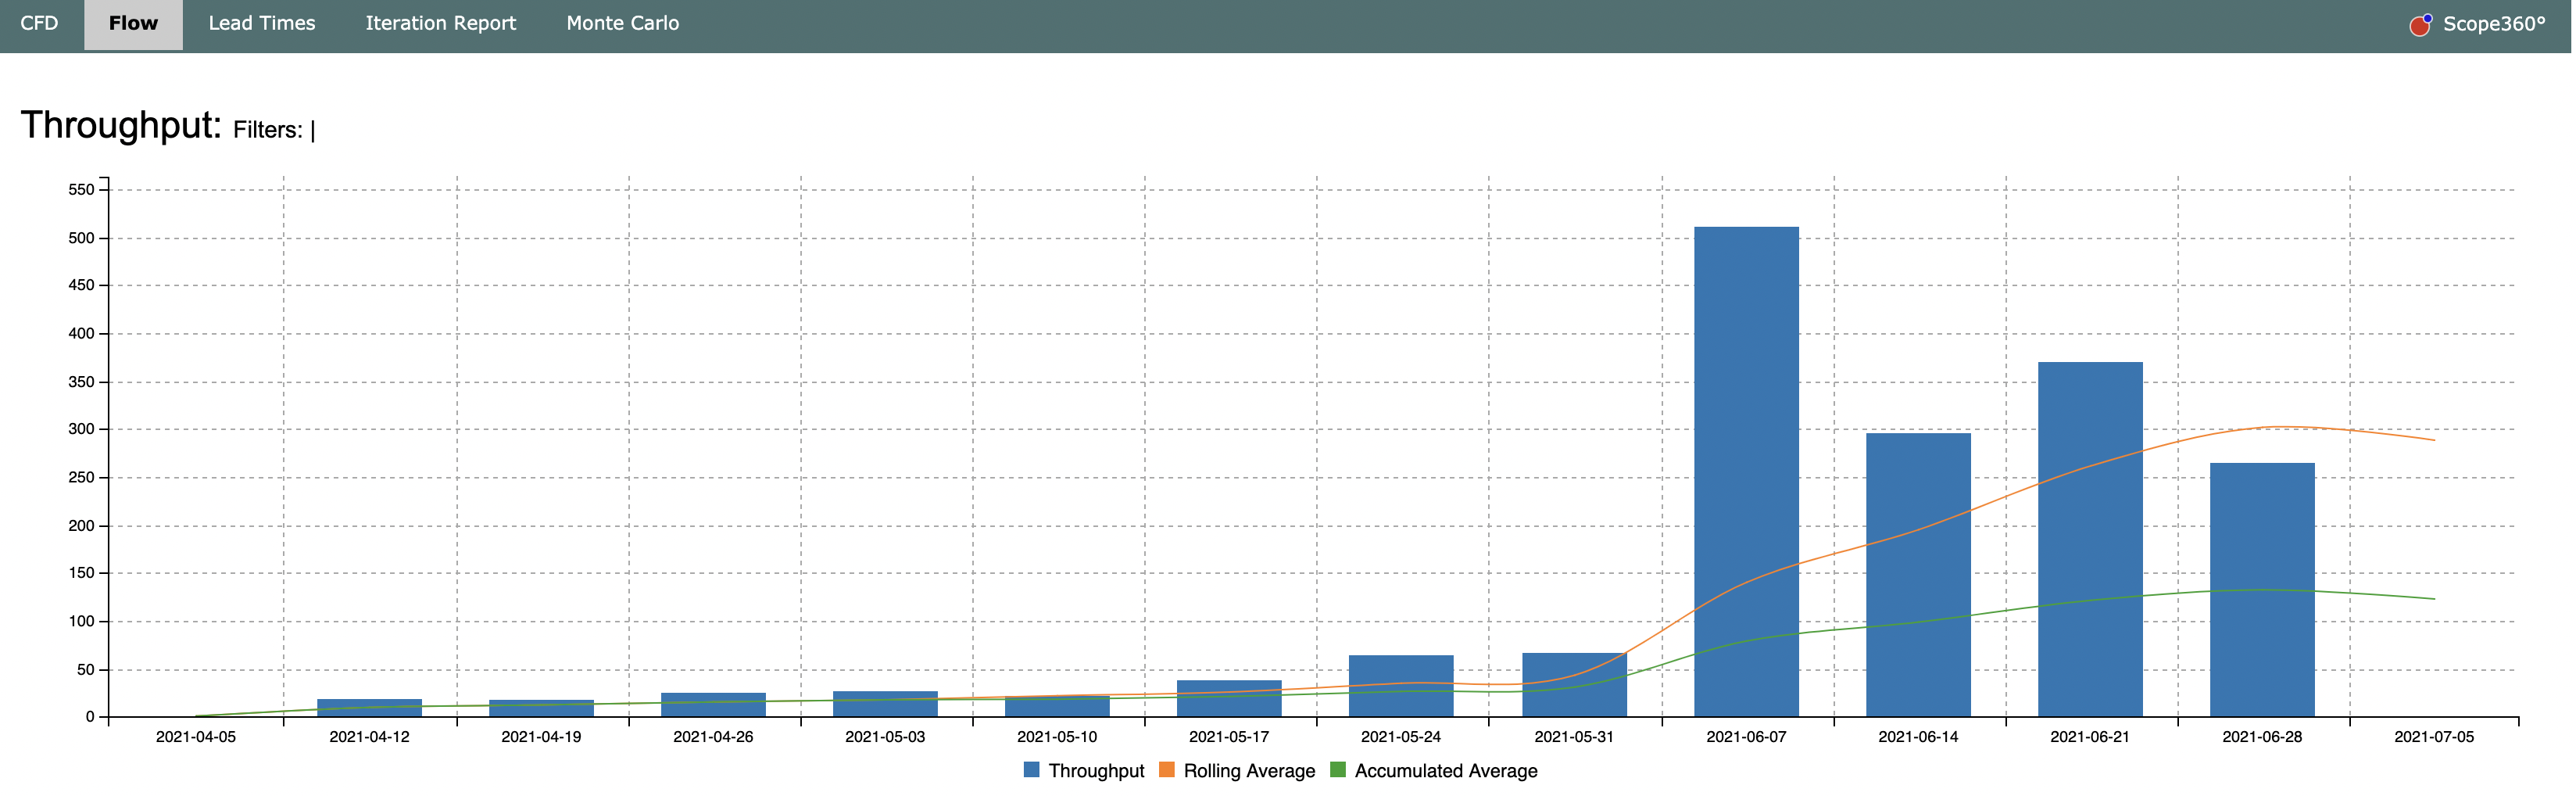
This view visualizes
- Throughput shows the number of closed issues in each timeframe
- Inflow shows the number of issues created in each timeframe
- Backlog growth shows the difference between throughput and inflow
- Lines show Accumulated Average and Rolling Average