
Plan
The plan is visualized through a number of complementary views. A view shows which deliveries each team has planned, including dependencies to other teams. Another view shows the team's plans iteration for iteration and a third view gives a status overview measured in the number of issues in each JIRA epic that has status to do, in progress and done.
Dependency Board
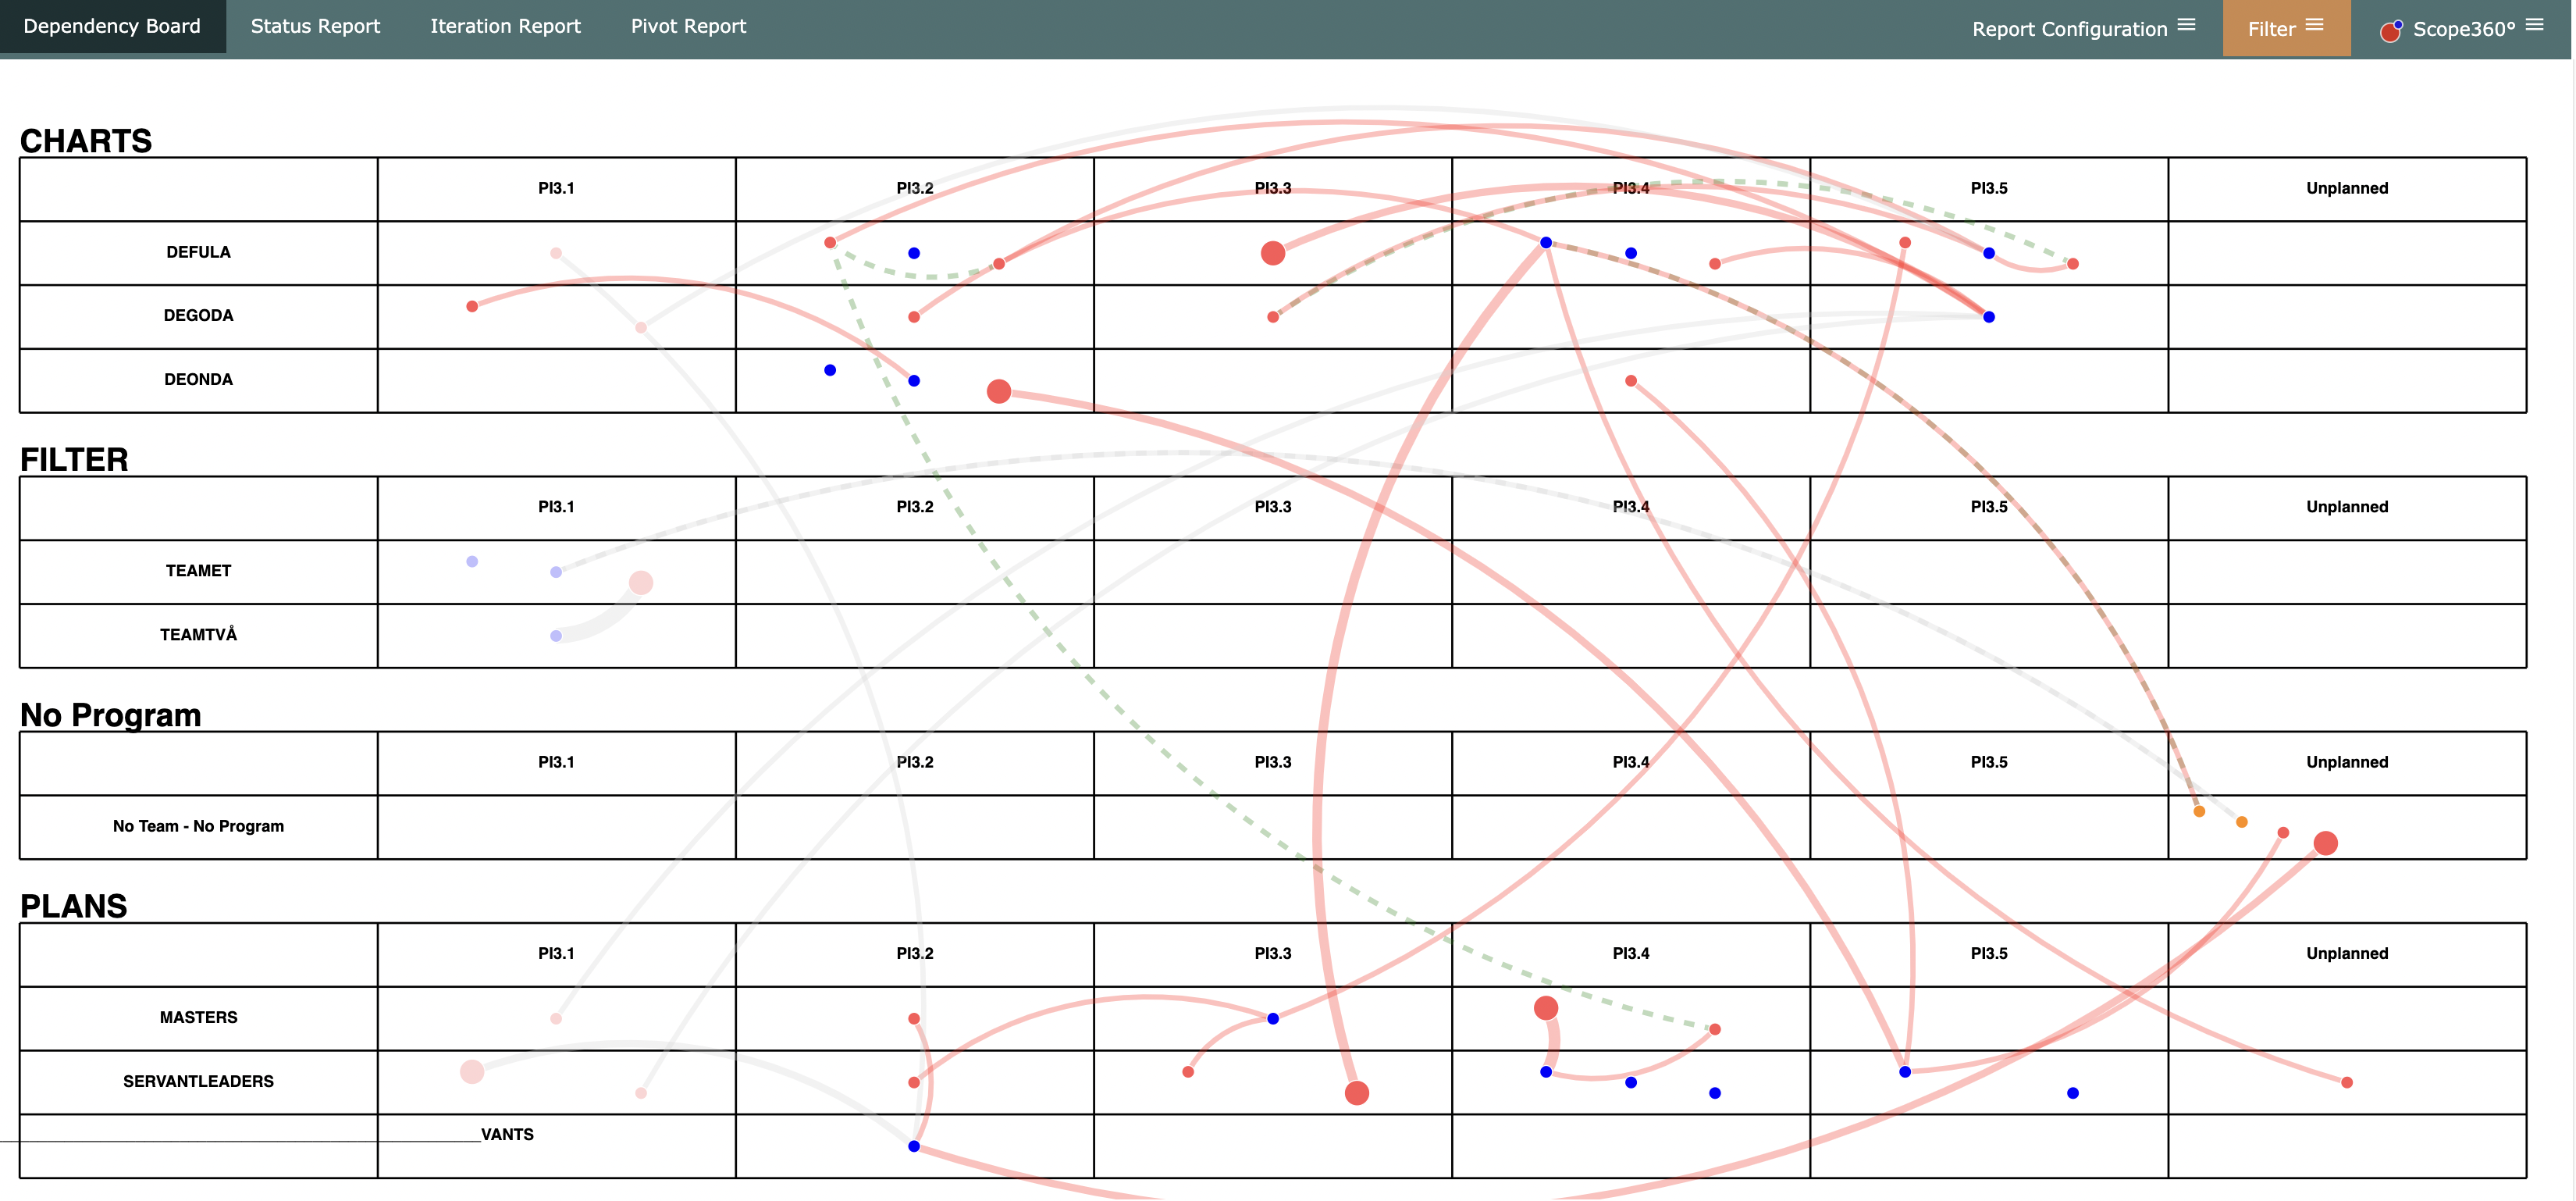
This view visualizes
- Dependencies between teams
- Dependencies between programs (ARTs or groups of teams)
- Data quality issues
- Unplanned iteration
- No Team
- No Program
- Dependency to be delivered after the feature itself
- Active work in closed iterations
- Hovering an issue will highlight all related issues
- Clicking an issue will filter out he related issues
Epic Report
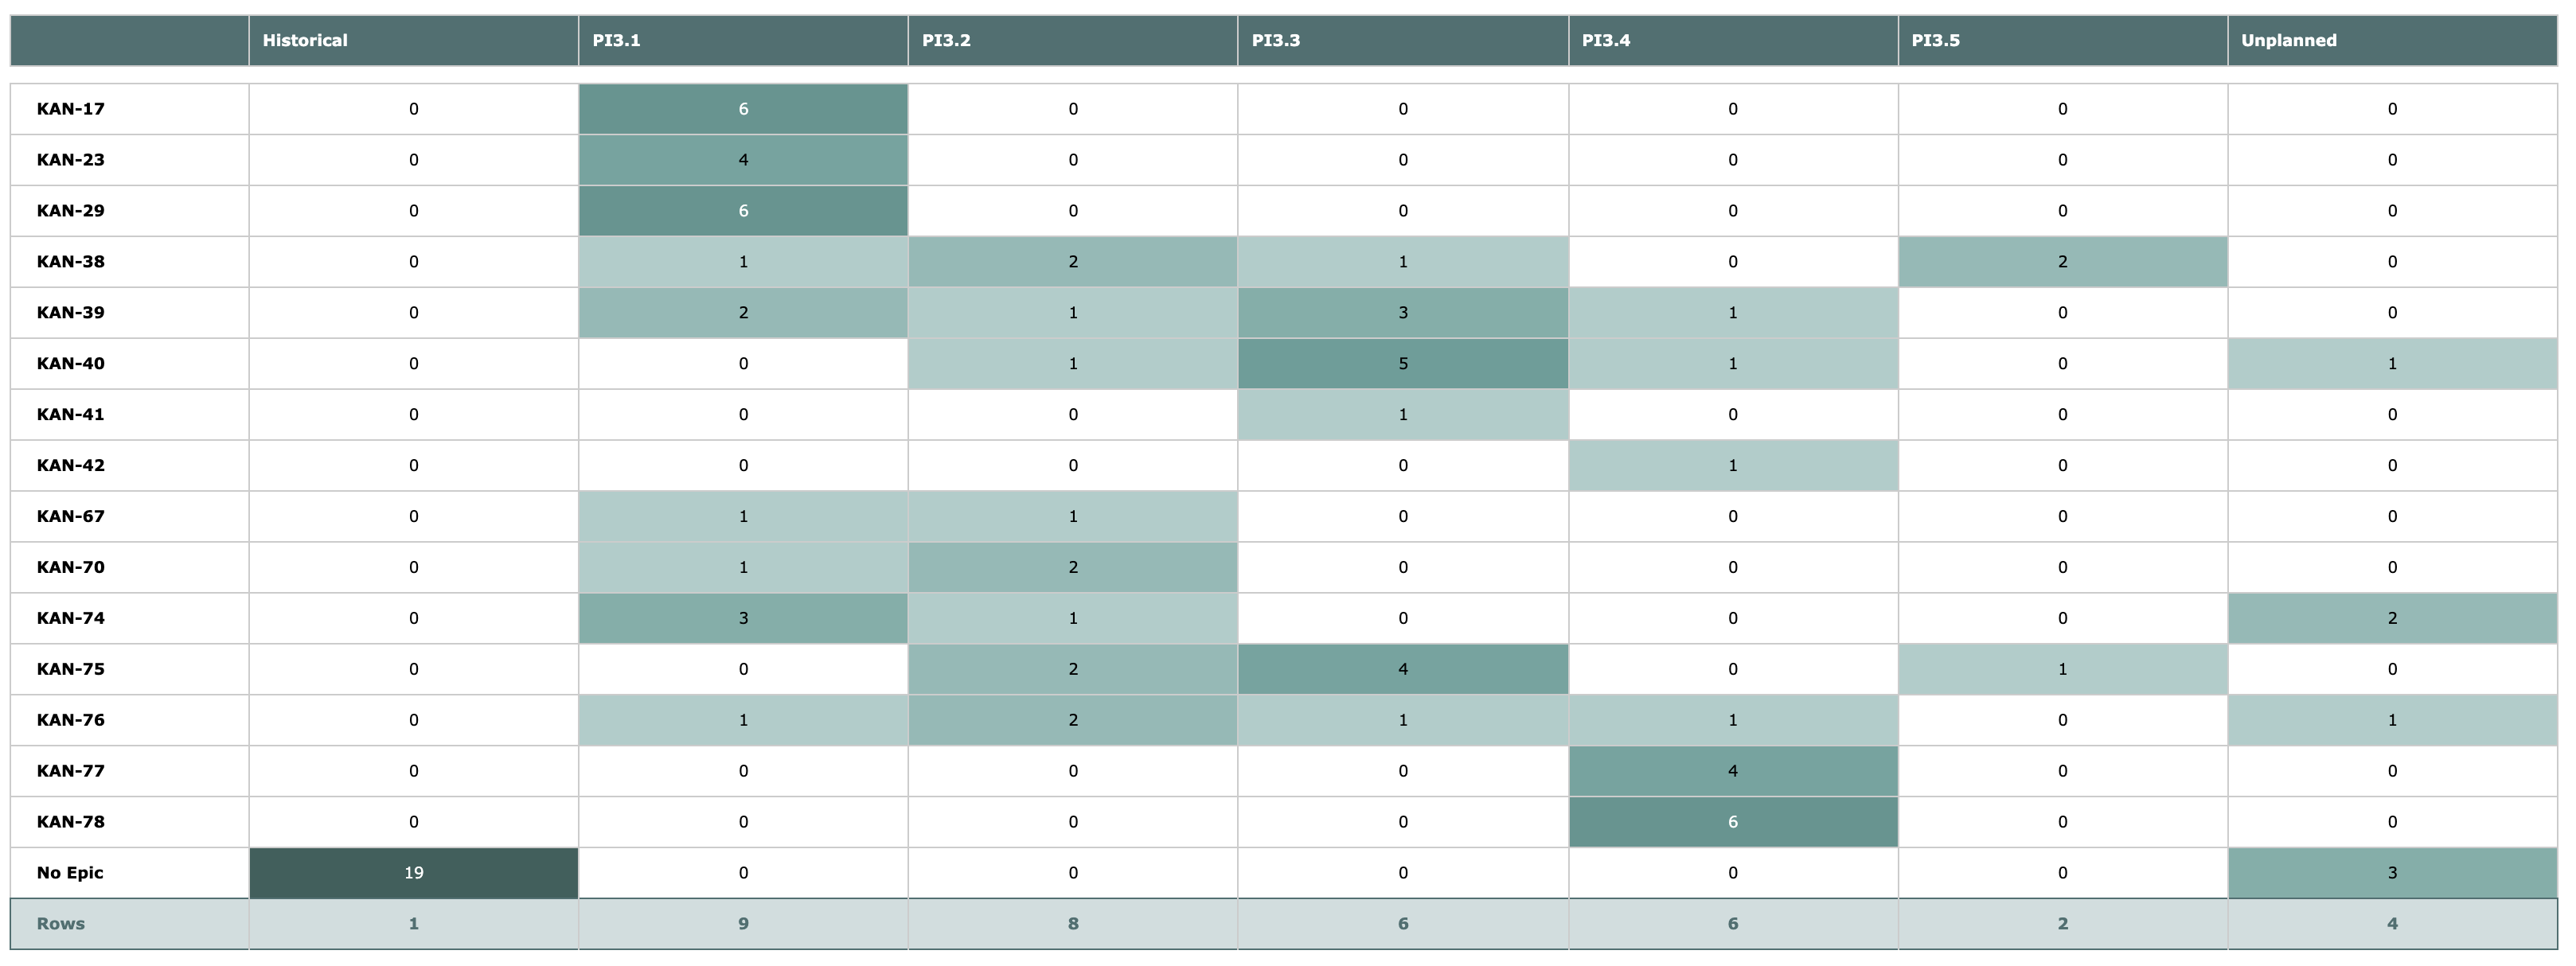
This view visualizes
- Gantt chart like view of the plan
- How many Jira Epics (Work In Progress) are part of the plan each iteration
- Intensity of work, darker color means more stories/tasks
Plan
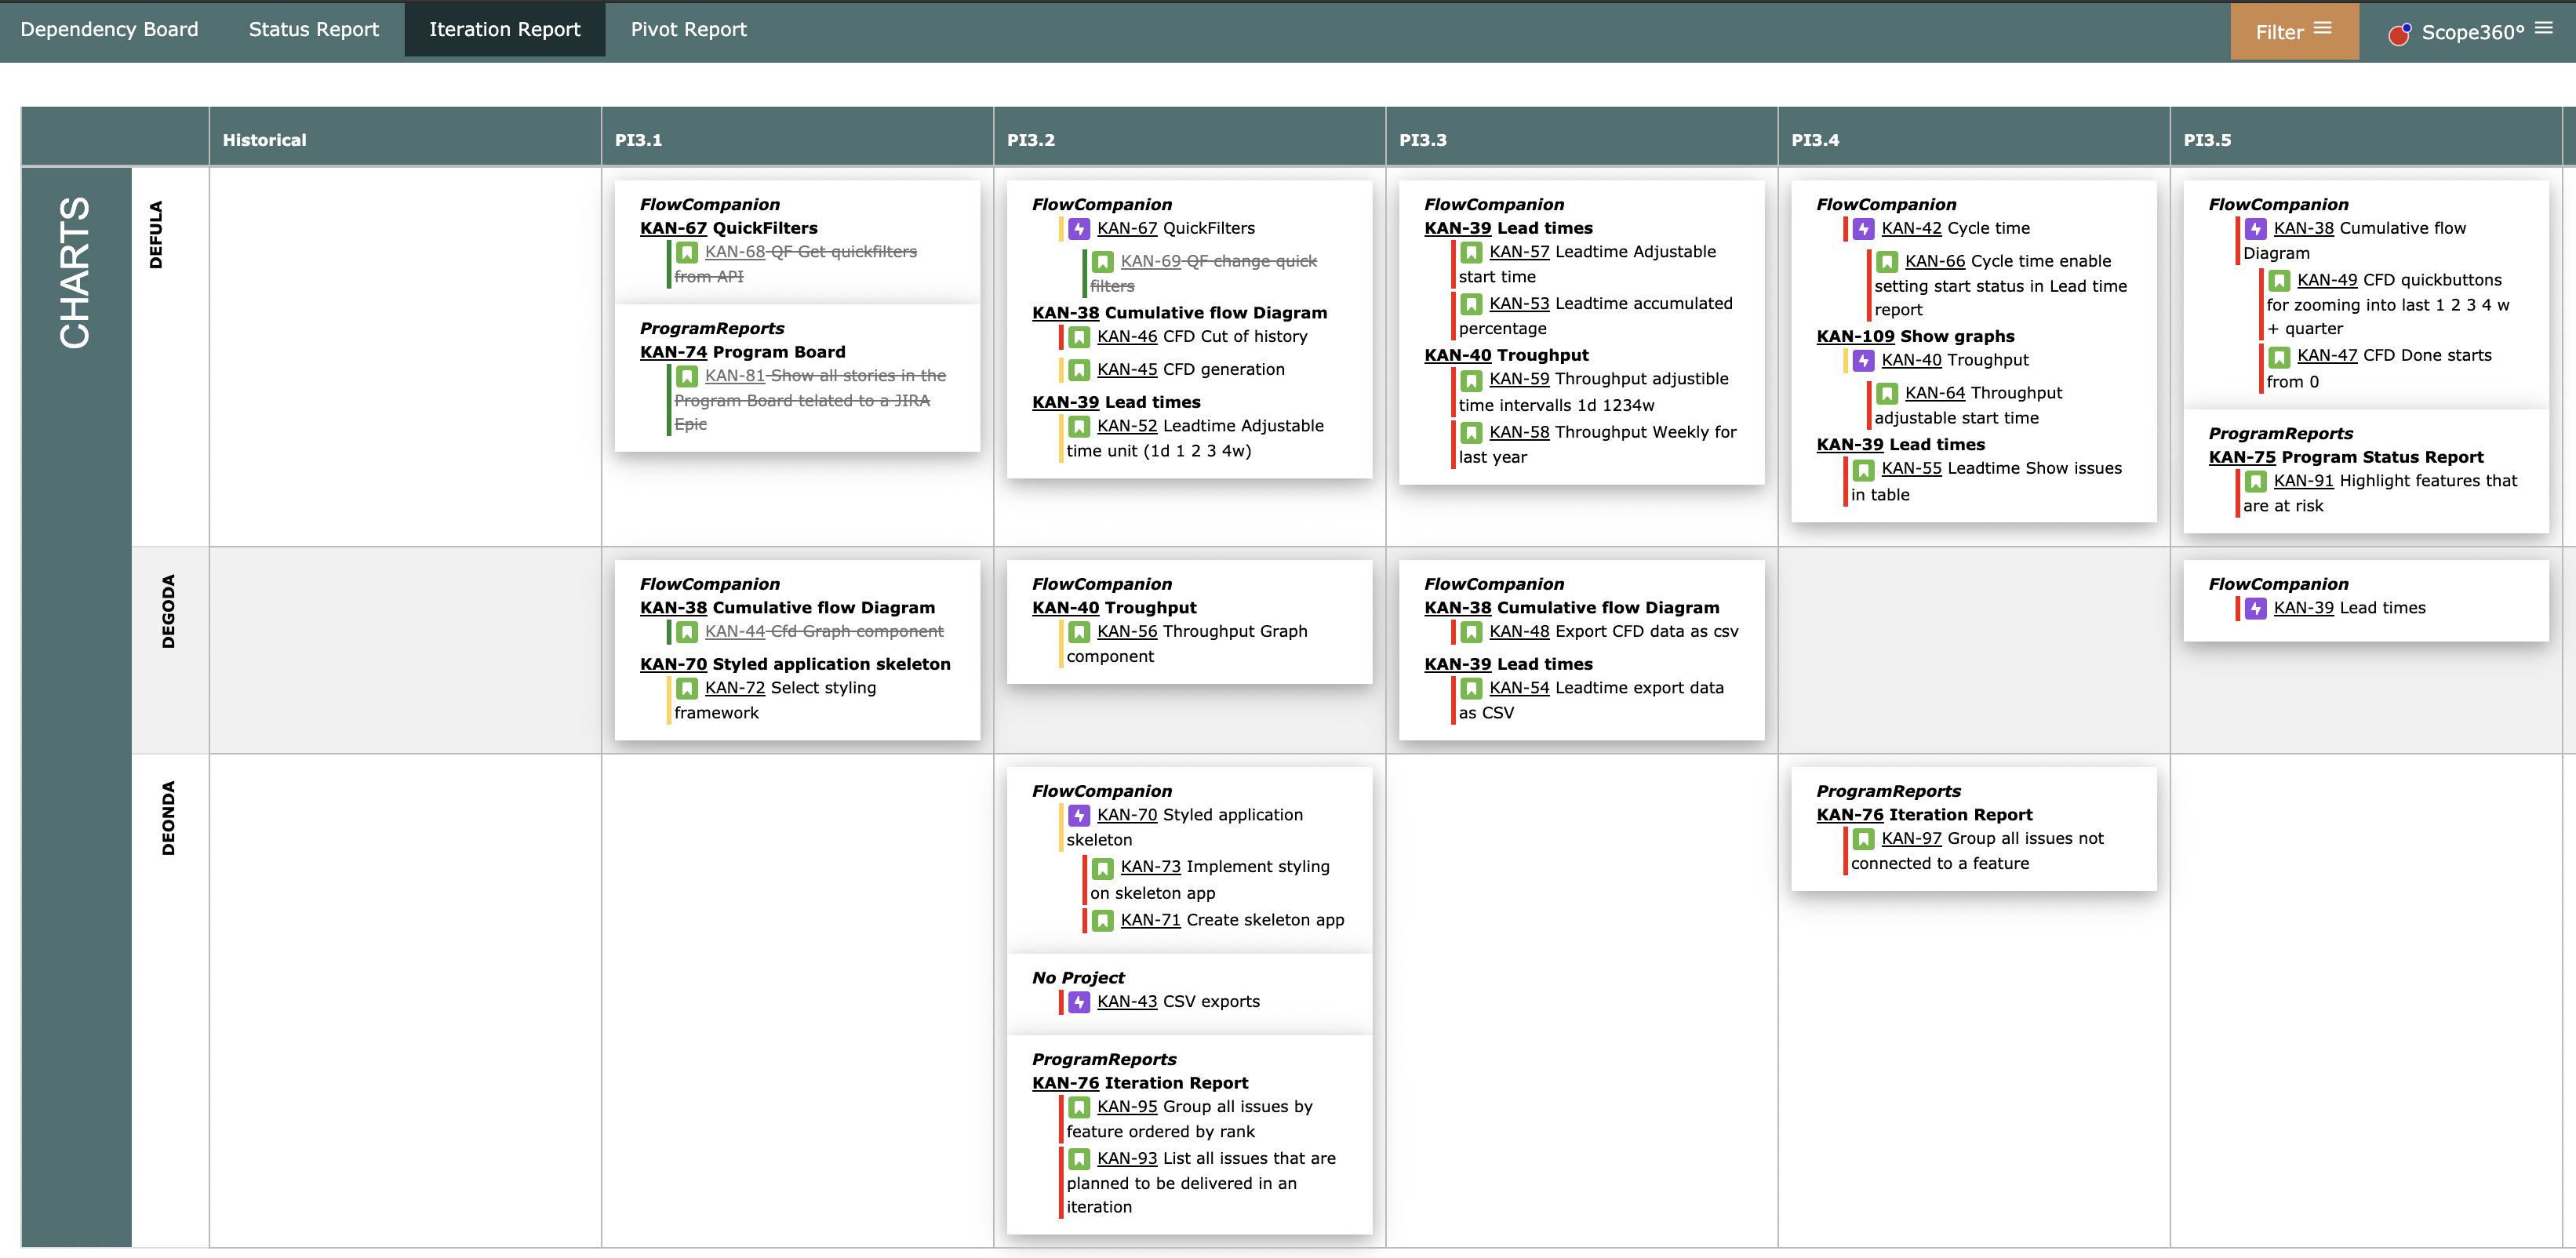
This view visualizes
- The planned work in iterations team by team
- Hover one issue and the related issues are highlighted
- Click on one issues shows only work related to that issues
- Done issues are green
- Stretch Features are blue
- Issues marked atRisk ar red
Status Report
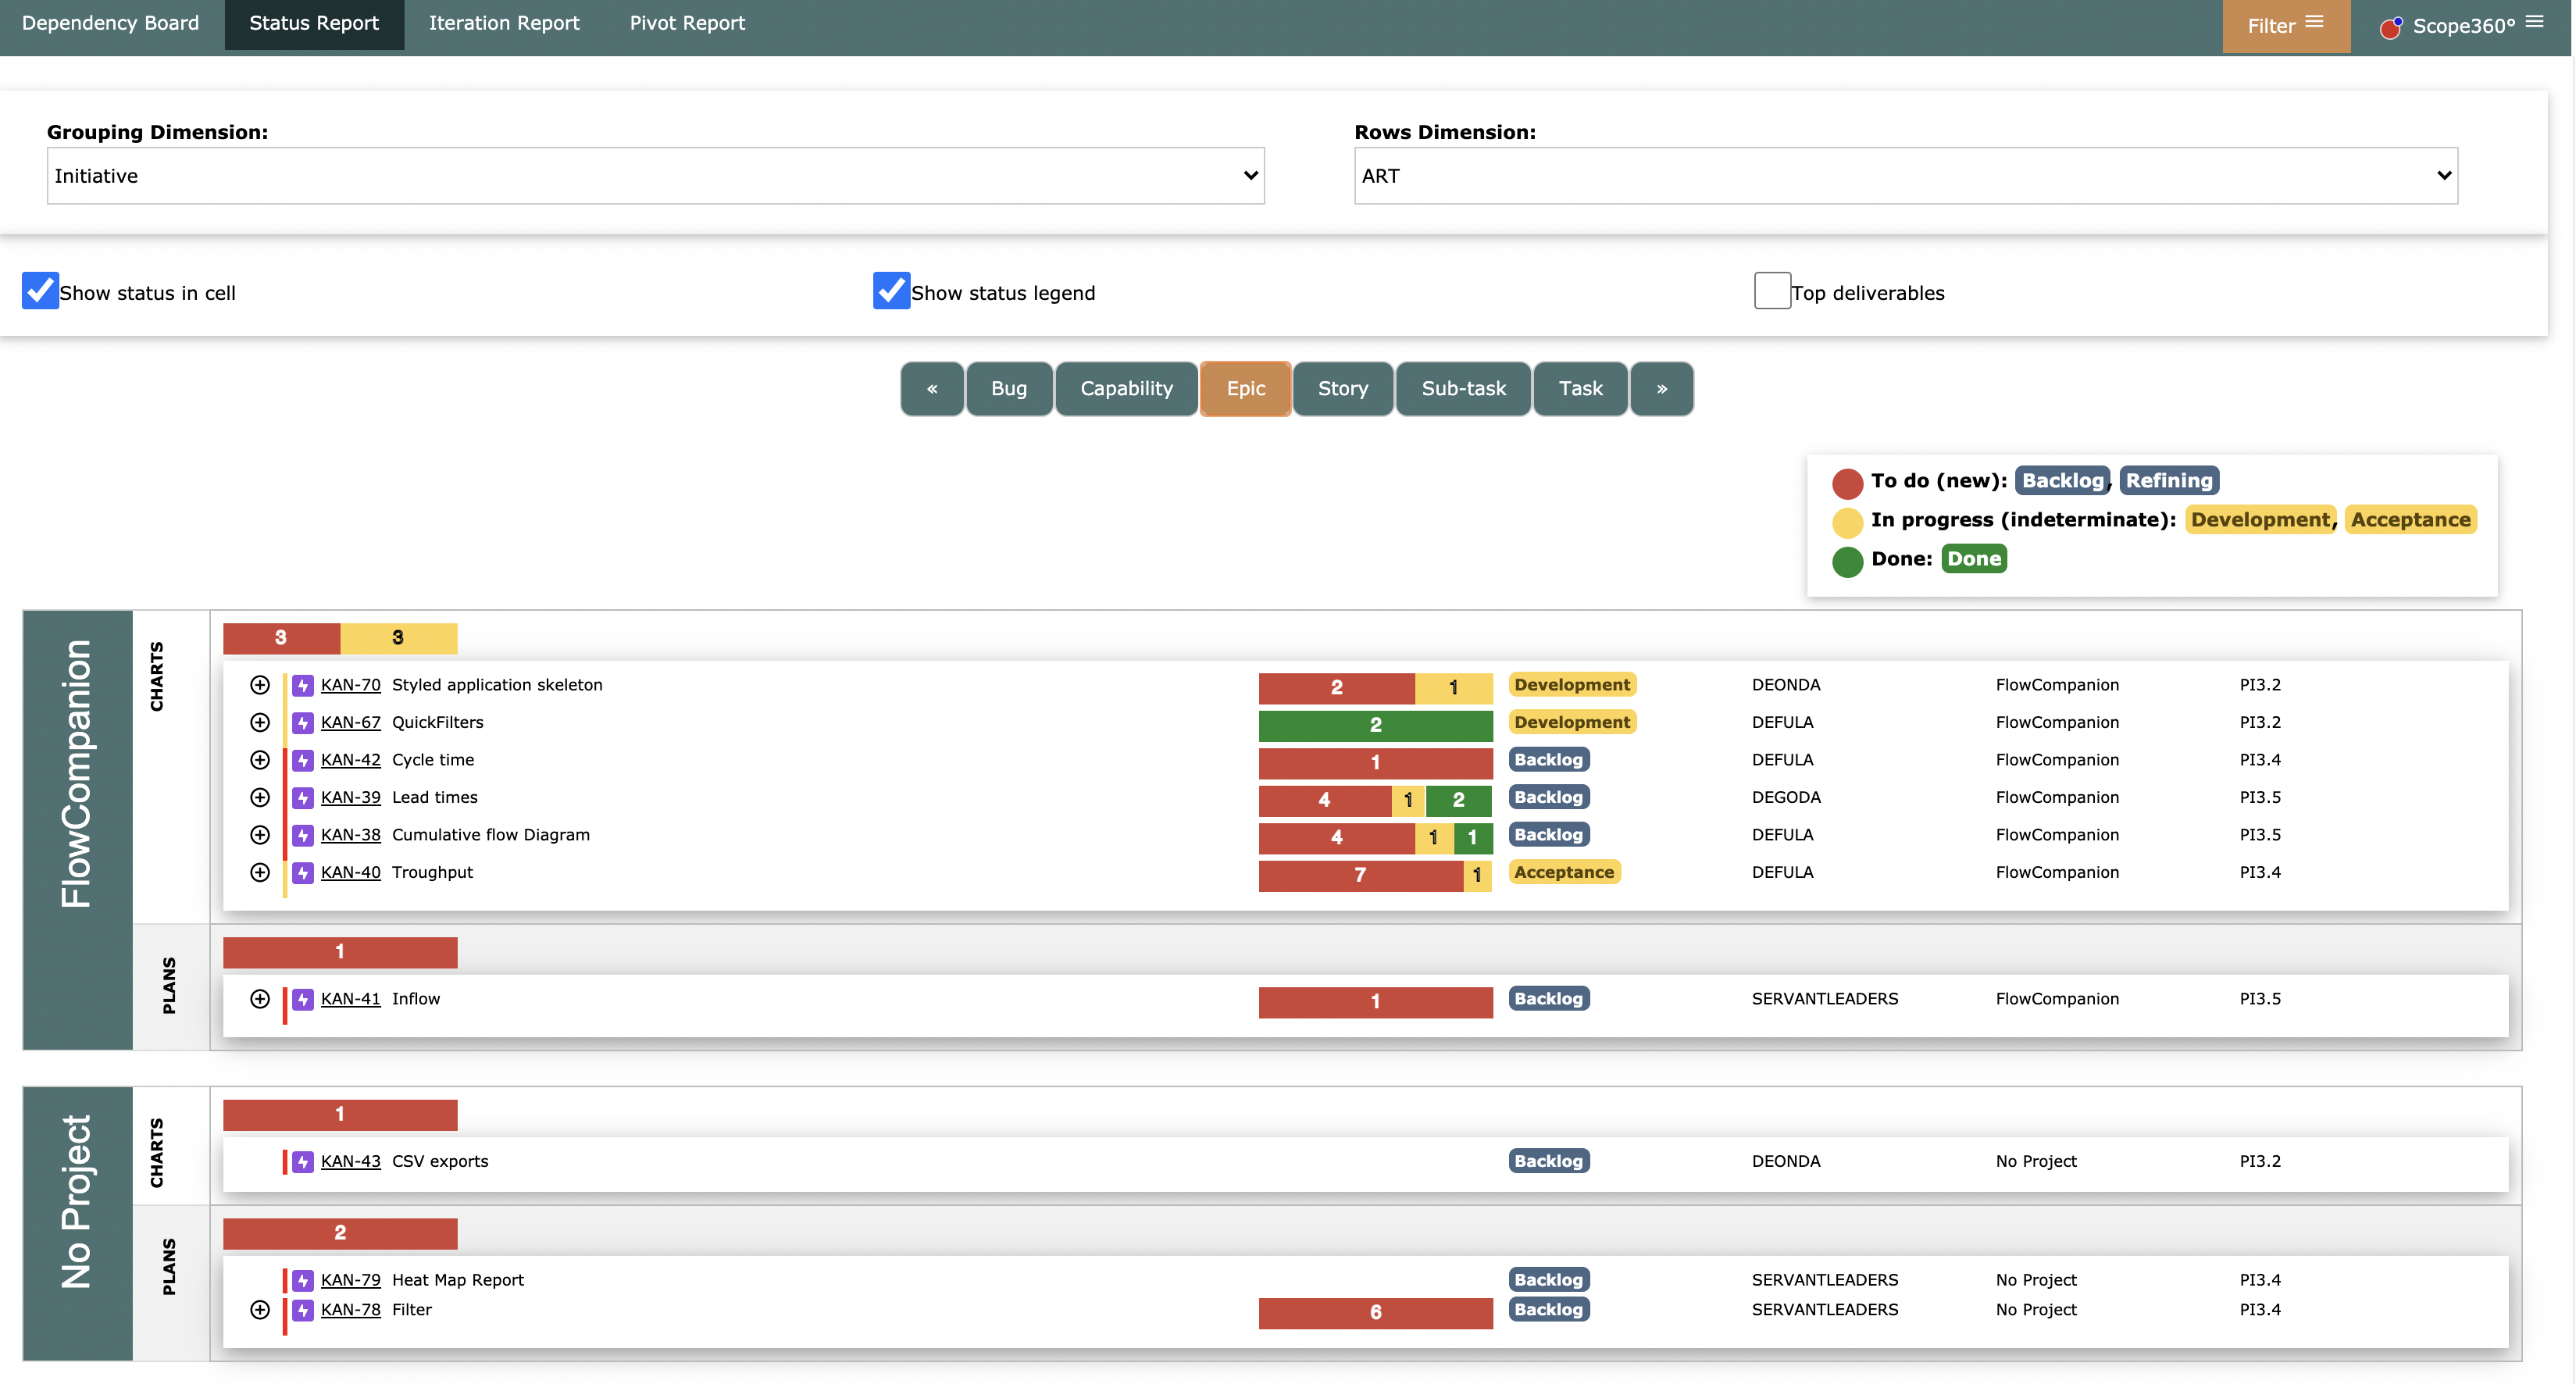
This view visualizes
- Status of features based upon status of stories/tasks
- Features grouped by Program or Project
- Features grouped by Iteration or Team
- Hiding features gives an high level status report
- Issues marked as atRisk will be highlighted
- Issues with data quality problem according to selected current iteration will be highlighted